The final forecast has been published. I started a more technical methodology post but never quite found the time to finish and publish it. If the forecast performs exceptionally well, maybe I’ll give everyone a peek under the hood. For now, I’ll keep it simple.
The inspirations for this project were the probabilistic forecasts from 538, Nate Silver, and The Economist. However, my model differs from these forecasts because it also draws significant inspiration from deterministic forecasts such as Election Predictions Official and The 13 Keys to the White House. The former create probabilistic outcomes by aggregating polling data and applying uniform polling errors to create a mix of scenarios, while the latter assess different fundamental factors to either pick a winner in each state or overall. While probabilistic models do consult 'fundamental' data, it’s largely phased out as the election nears.
2020 was a great year for the fundamentals. The 13 keys were right, and Election Predictions Official correctly predicted 49/50 states.
My state fundamentals metric weights each state's past voting patterns to determine its 'lean.’ After the ‘lean’ is determined, I add it to the national popular vote estimate . For instance, if Ohio historically leans 8 points to the right of the national average, and the country is estimated to vote 2 points to the left, then Ohio would be predicted to vote for the republican by 6 points.
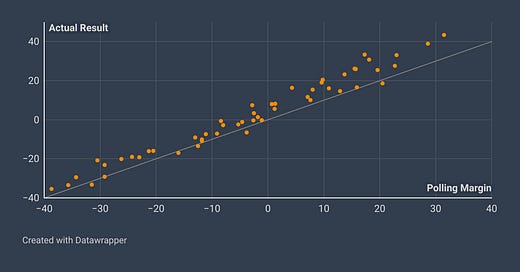
This metric was a stronger predictor of the final results than the polling averages in the last election cycle. The following graphs show the predicted Republican margin of victory in each state compared to the actual Republican margin (a negative value indicates a margin of defeat). The grey line represents perfect accuracy.
My forecast derives its final odds from both of these metrics (along with betting market data). However, because of this, my model is significantly more “Trumpy” than other probabilistic models. The fundamentals appear especially “Trumpy” largely because of the popular vote estimate. The popular vote estimate is a regression equation that considers the national polling average, economic data, whether the incumbent party nominee is the sitting president, and the incumbent party job approval. Of these, the national popular vote polling average carries the highest weight. I think of all the numbers and data to speculate at, the national popular vote polls have been the most concerning for Harris, even though the national popular vote does not determine the winner.
In 2016, Hillary Clinton won the popular vote by 2.1 points yet lost the electoral college by around 77,000 votes spread out between the three decisive states of Wisconsin, Pennsylvania, and Michigan. In 2020, Joe Biden more than doubled the popular vote margin to 4.5 points and won the electoral college by just 43,000 votes spread across Arizona, Georgia, and Wisconsin.
Harris leads by just 1.1 points in The Breakdown Point’s final national polling average and an even slimmer 0.9 points in the forecasted popular vote. Other models show similar results: 538 has Harris up by 1.2 points, Nate Silver by 1 point, and Real Clear Politics by just 0.1 point.
Because my forecast makes a deliberate use of the national polls to inform the fundamental data, Trumps odds have been great since October 1st.
My opinion is that a forecast like this is a good way to think about elections, especially in the Trump era. I got further confirmation of this when I compared my results to Polymarket, the world’s largest betting market.
My final numbers are still better for Trump than Polymarket, and perhaps this is due to the lack of conversation around the national popular vote and the current political environment appearing to be much better for Trump than 4 years ago. Maybe Polymarket’s odds are weighed down by the forecasts of Silver, Lichtman and others. Or more likely, it’s that those models are better representations of the reality on the ground. If the polls outperform the fundamentals, then this thing truly is a tossup. If the fundamentals outperform the polls yet again, then Trump probably walks away with over 300 electoral votes. To simplify my forecast, it weights these two scenarios as roughly equal, giving a slight edge to polls.
As for me, I really don’t know what will happen tonight. I think I land pretty close to what the betting market thinks. My gut says Trump will win with about 60% certainty, but to put this in perspective, let me give my gut’s record:
2008: Obama, 95% certain
2012: Obama, 75% certain
2016: Clinton, 99% certain
2020: Biden, 80% certain
Not terrible, although the year I was most certain was the year I was most wrong. It has been an interesting election to say the least, and tonight should be interesting as well.
If the model does well enough, maybe there will be a recap article after the election. If it does poorly, then I’ll probably bury my head in shame. Either way, I hope you come back next year as I plan to get my baseball data projects out before the 2025 MLB season kicks off next March.


